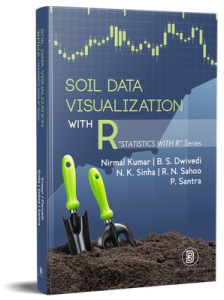
Soil researchers generate several types of data from classical results of experimental designs, soil physical and chemical analysis, and pedological researches. An appropriate visualization of these data and their analysis in
form of statistical graphics, plots, and information graphics can stimulate viewer engagement and attention. Besides the classical graphs and charts,representing soil data needs some special infographics such as textural
triangle, piper diagram, soil-water retention curves, etc. The data of pedological research needs to be represented in another set of plots which include soil profile graphs depicting the horizons sequence with depth of the soil profile, soil color graphs, and the horizon and color transition sequence probabilities. These graphics can help developing the physiography-soil relationships and segregation of soils. This book explains the use of R platform in producing publication ready infographics from the soil data with examples.
The book starts with initial guidance regarding installation of software and packages in R and the procedure of importing and exporting different formats of tabular data into and from R and its manipulation. Then the book
explains the visualization of descriptive statistics, analysis of variance (ANOVA), and relationships among soil properties. The book provides a practical guideline to prepare soil textural triangles in different classification
systems and to visualize pedological and soil survey data in form of soil profile plots, soil color plots, and clustering and segregation of soils based on morphological and physic-chemical properties. A dedicated chapter also discusses visualizing physical and chemical properties of soil water such as, soil water retention curve and Maucha and Piper diagrams representing ions in the soil solution.
Download and Installation
Data Handling
Visualizing Descriptive Statistics
Visualizing Analysis of Variance
Regression and Correlation Matrix
Plotting Textural Triangle
Visualizing Soil Profile Data
Depicting Soil Color
Seggregation of Soil Types
Visualizing Soil Water Data
List of Packages Used


